Federal Liberals and NDP tied among City of Vancouver voters
2015-10-10
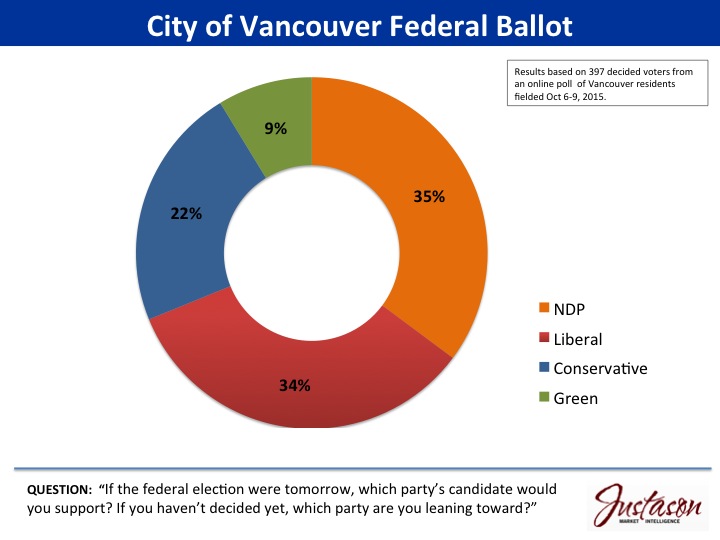
Vancouver B.C. (10 Oct 2015) – The NDP and Liberals are in a dead heat in the City of Vancouver, according to the most recent federal election poll from Justason Market Intelligence.
As we enter final stretch of the longest federal election in modern Canadian history, 35 per cent of City of Vancouver’s decided voters will support their NDP candidate, while 34 per cent will support their Liberal candidate. Support for the ruling Conservatives stands at 22 per cent in the City of Vancouver, while the Greens receive 9 per cent support.
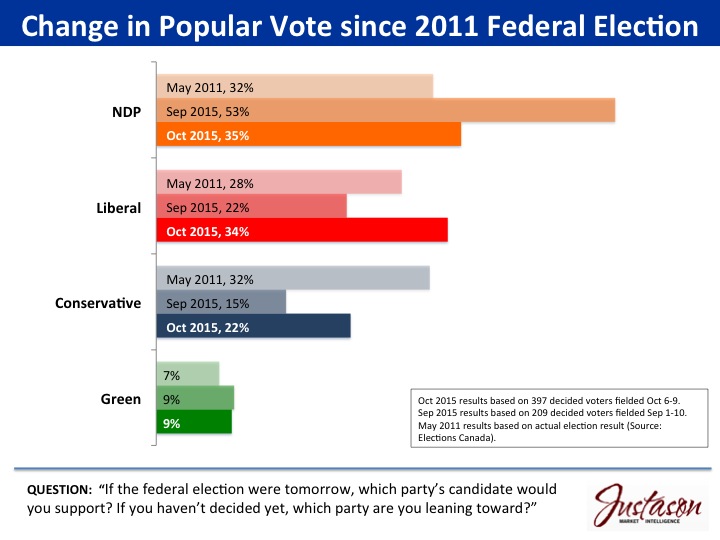
In the May 2011 election, the Conservative and NDP parties were tied in popular support, with 32 per cent of Vancouver voters supporting each. The Liberals received 28 per cent of the vote. The Greens received seven per cent support.
Currently, the Liberals are enjoying a meaningful growth in support (to 34 per cent) as NDP support fades (from 53 to 35 per cent) following a spike in support in September. Among City of Vancouver voters, Conservative support has rallied somewhat (from 15 to 22 per cent) since September.
Demographics
GENDER
Support among men is about equally divided among the major parties, while women lean away from the right, favouring Liberal and NDP.
- NDP and Liberal support is higher among women than men:
- 36 per cent of women support Liberal versus 32 per cent of men; and
- 40 per cent of women support the NDP versus 31% of men.
- Men are twice as likely as women to support the Conservative party (30 versus 15 per cent).
AGE
Among the age groups, the poll finds 18 to 34 year olds most likely to vote NDP (43 per cent) followed by Liberal at 35 per cent; 35 to 54 year olds support Liberal and NDP about equally (34 and 32 per cent); and voters 55 and older are about equally divided, with 32 per cent of this age group supporting each of the major parties. More specifically:
- NDP support is highest among voters under 35 years (43 per cent), decreasing to 32 per cent among residents 35 years and older;
- Liberal support is drawn about equally from all age groups (32 to 35 per cent); and
- Conservative support increases with age:
- 18 to 34 year olds: 13 per cent;
- 35 to 54 year olds: 21 per cent; and
- 55 and older: 32 per cent.
HOUSEHOLD INCOME
The poll finds a relationship between household income and party support. NDP support declines with income (from 44 per cent among those earning less than $40K to 28 per cent among those from households earning $100K or more). Conservative support, on the other hand, increases with income (from 13 to 29 per cent). Liberal support increases, albeit less dramatically, with household income (from 30 per cent among the lowest income groups to 39 per cent among residents with household incomes of $100K or more).
PERSONAL SITUATION
City of Vancouver voters who have children living in their home are most likely to support NDP (39 per cent versus 28 per cent Liberal and 23 per cent Conservative). Voters who live with a romantic partner are most likely to vote Liberal (37 per cent versus 31 per cent NDP and 26 per cent Conservative). Single voters are most inclined to support NDP (38 per cent) followed closely by Liberal (34 per cent). Just 16 per cent of single voters will vote Conservative.
RENTERS AND OWNERS
Residents who own their homes are about equally likely to support the Liberals and Conservatives (34 and 33 per cent respectively), while NDP support stands at 27 per cent of voting homeowners.
Voters who rent are most likely to vote NDP (44 per cent), followed by Liberal (32 per cent). Just 13 per cent of voters who rent will vote Conservative.
Research Notes
These are the findings of a Justason Market Intelligence Inc. online poll of 467 adult citizens of the City of Vancouver. The firm’s panel of Vancouver residents was the sample source.- Dates of research: October 6-9, 2015.
- Sample: This research relies on a non‐probability sample of 467 City of Vancouver residents 18 years and older who are members of the JMI City of Vancouver residential panel. The sample included 397 decided voters. The final data were weighted to represent actual regional and demographic distributions according to the most recent census.
- Methodology: Online among JMI panel members.
- Margin of error: A pure random (or probability) sample of 467 reports a margin of error of ±4.5 percentage points, most (95 per cent) of the time. On 397 decided voters, the margin of error would be ±4.9 percentage points most (95 per cent) of the time. Subgroups such as specific age or gender groups carry wider margins of error.
- Research Sponsor: Justason Market Intelligence Inc.
Direct: +1 604 783 4165
Email: Barb@JustasonMI.com
web: JMI.co twitter: @barbjustason – 30 –